Using stm studio for variable monitoring

What it does is parsing the elf file to find where the variables are stored in memory.
Then it reads or writes the memory with SWIM protocol (STLINK protocol) I think.

I was even thinking about rebuilding this tool in web in a more user friendly way after seing this

But sorry that’s off topic

That uses webUSB as should the web_SimpleFOC_Studio. Maybe a chance to see that happening.

I also tried the STM32CubeMonitor in the past, I think it’s the replacement for STM Studio, it has more features but I couldn’t get it to acquire data as fast as STM Studio.

1 Like

Hey Candas1, I want to try this, but I don’t know how to set up current sense, not quite. I have some idea but am painfully aware of how things can get complicated.

Can you post the exact code you used? I can extract the critical elements and make some elemental code to monitor current with this board.

I want to monitor current to do stall detection. The best thing for me is to watch the combined current of all three phases. That way I can take a single measurement and see what the current draw is, no need to average out a bunch of measurements on a single phase.

Unfortunately I am away from home.
But I picked code from this example

1 Like

Here is how I was able to reproduce it.

first add a build_opt.h file in your arduino sketch and add inside the line -g -ggdb

Then add a variable in your Arduino loop that you wanna log.

For example the current measurements as suggested by @Candas1


PhaseCurrent_s current;
void loop(){
    ....
    current = current_sense.getPhaseCurrents();
    ....
}

And then compile the code.
Onece when your code is uploaded and complied it will output:

Open your stmstudio and import the variables form the elf file indicated by the arudino ide compilation

And then add the variables to the viewer

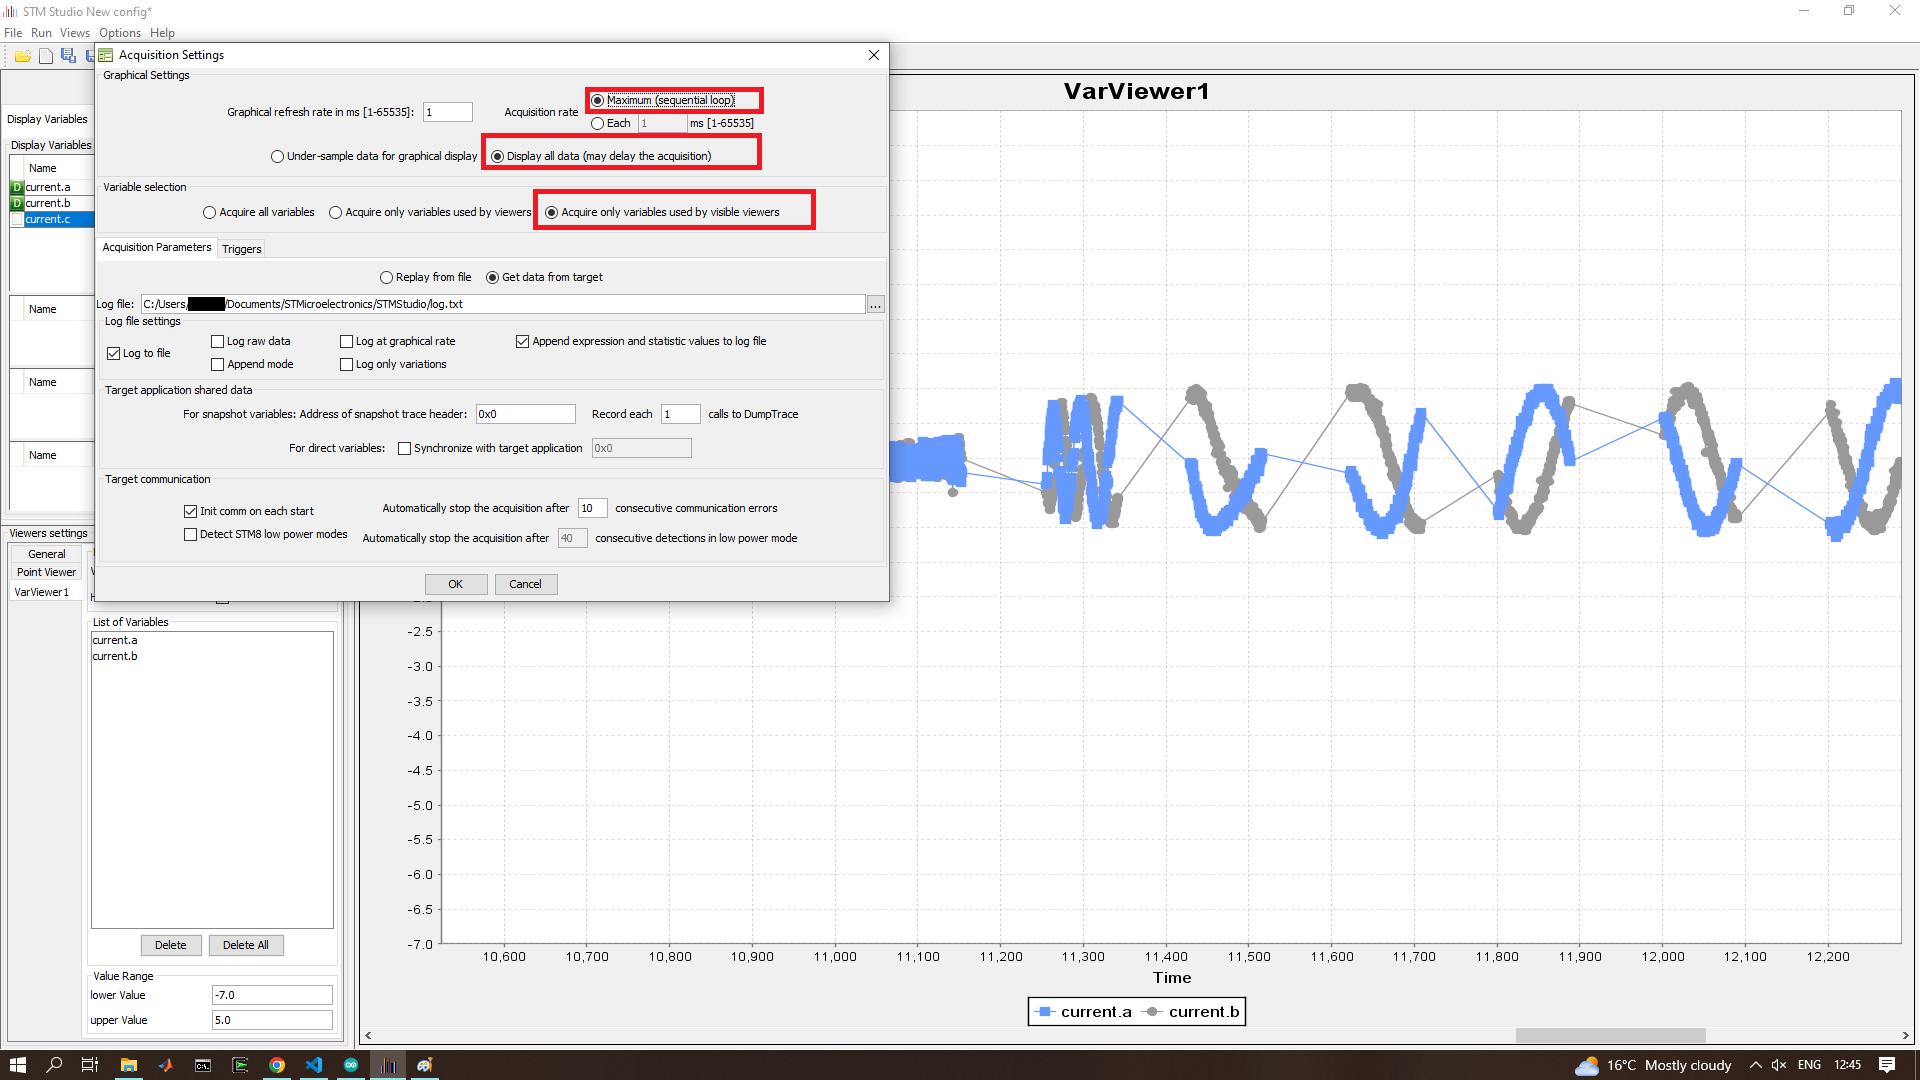
For more precision of the visualization you might need to adjust the acquisition settings. In y case I’ve used these settings:

3 Likes

STMViewer is a new open source tool worth following.

2 Likes

I have been using STMViewer for some time now, I must say I like it.
You can add a variable, type the name of any global variable like motor.LPF_current_q.Tf, update the variable address, and it just works.

And this way of debugging is less intrusive, it shouldn’t slow down your code.

2 Likes

how do you use it? Compile, upload using arduino, and then what?

You can download STMViewer from here.
Here are the installation instruction.
I believe it needs at least version 13.2 of GDB (issue).

I am compiling with platformio using -g -ggdb build flags, this ensures proper information are available in the .elf file.
I made a short video showing basic usage of the tool.

If you change your program, the memory addresses might change, so you need use the Update variable addresses button.

This should support different model of stlinks and should work on STM32 only.
But it works for me with a Chinese STlink V2.1 clone and GD32F103/GD32F130 chips also.

Yeah but after downloading it, like what’s the process? You compile with arduino, how does it know the memory address? Doesn’t it need to have info from the compiler somehow to know the address of a variable and it’s name? I don’t see how it can get that info.

Oh ok a video is awesome, sorry. Will check it out thanks! Looking in there and seeing the system working is extremely important but in arduino it’s quite hard.

Edit:hm, how do you get this mysterious .elf file? It’s the binary I take it?

It’s generated together with the bin file if you use the build flags I mentioned

2 Likes

But just one thing I want to clarify, I don’t want to send the wrong message.
SimpleFOCStudio is best for most users:

  • I works on any MCU as it relies on Serial communication
  • It’s designed for SimpleFOC

But there are specific use cases when tools like STMViewer are useful:

  • you can sample every 1ms, it’s very useful to visualize phase current
  • it’s not slowing down your program, maybe it helps with PID tuning on slow MCUs?
  • you can easily edit/display your own variables or variables that are not exposed by the commander

So more for advanced users/developers.

Anton wrote how to trigger the platformio debug toolchain from Arduino-code

first add a build_opt.h file in your arduino sketch and add inside the line -g -ggdb

Just to clarify: this “build_opt.h” file doesn’t already exist somewhere in my arduinoIDE libraries?
I don’t have to edit it and add the -g -ggdb line, but have to create a new file? Is that correct?

I never figured out build options with arduino very well, but there was a file specific to each family of boards that contained a section where the build options were located. There are some instructions I think I left on the forum for modifying some of them in some ways, the build options were needed to get current sensing working with the b-g431b-esc1 board.

Why would you use platformio’s debugger from inside ArduinoIDE? That doesn’t make that much sense for most people, I think.
At that point it would be easier to just use PlatformIO, for code and debugging, and not have to deal with the idiosyncrasies of both IDEs at the same time?

2 Likes

definitely my plan for when I try to do stuff with the lepton 3.0 eventually is to use platformio

why not start today :grin: it’s significantly faster and easier to configure than arduino IDE

For me it isn’t about debugging code, but watching variables without slowing down the loop.
Maybe find better PID values here and there…
I’ve started using sFOC for different MCUs supported by arduinoIDE, why would I switch to another platform?

Well, I believe the current version of ArduinoIDE include debugging support?

My point was not that anyone should change IDE… everyone should use whatever they like best. I was just suggesting that using and configuring 2 IDEs is a complicated way to work. But if it’s right for you, then its right for you :smiley: